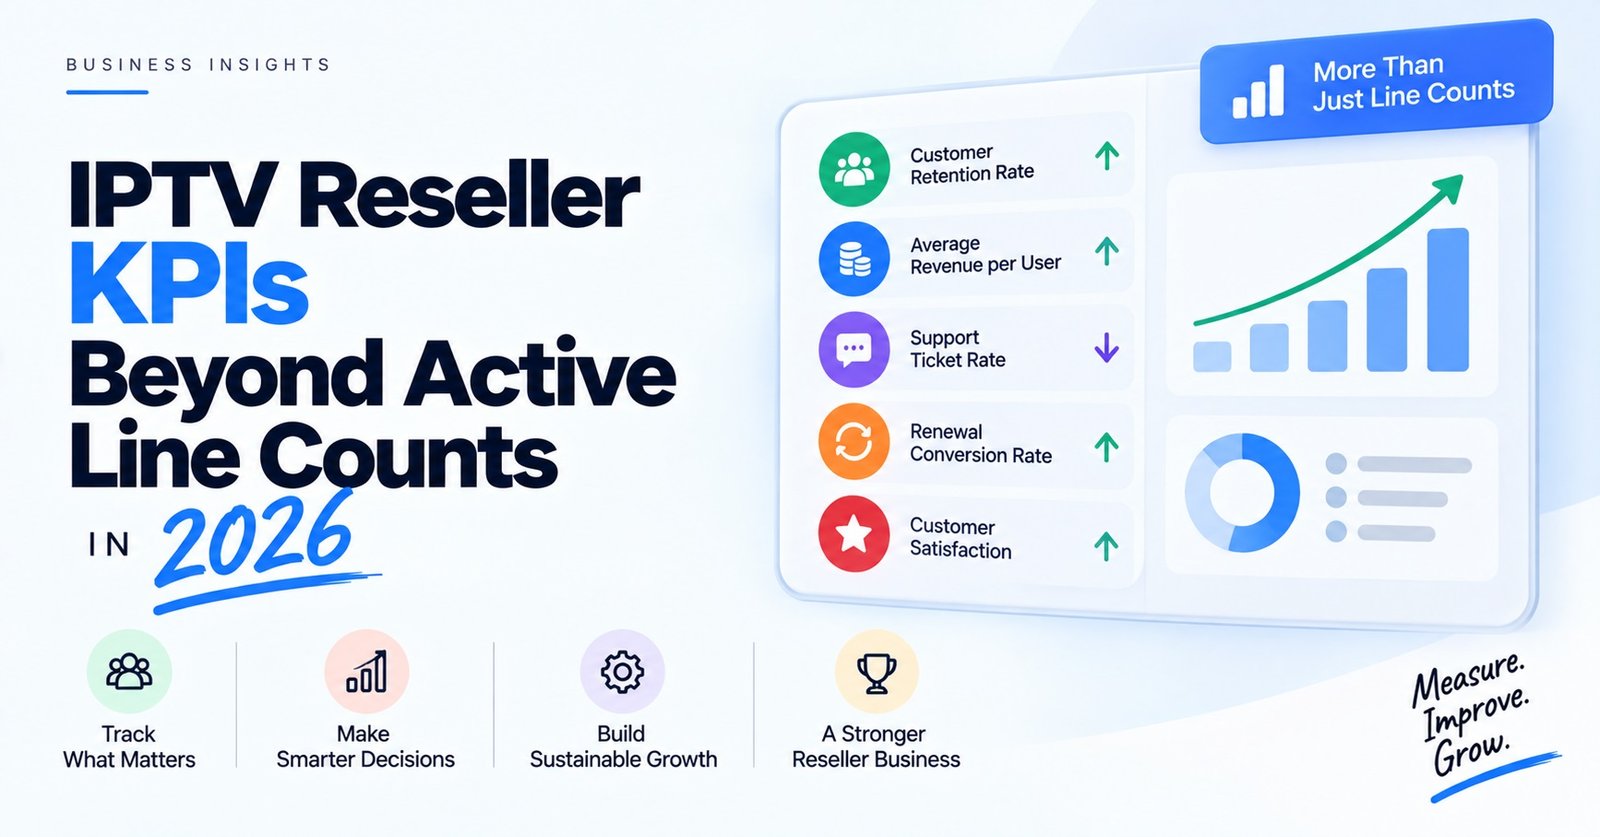

The IPTV Reseller KPIs worth tracking are the ones that tell you whether customers stay: renewal rate at expiry, first-month drop-off, trial conversion, support tickets per active line, time from payment to a working stream, and what each subscriber actually earns you once support time is counted. Active line count, the number most panels put front and centre, is a result of those six rather than a measure of health in its own right.
Start by separating what your panel records from what you have to record yourself. A IPTV panel reseller dashboard will tell you how many lines exist and when they expire, but it will not tell you why a customer lapsed, where they found you, or how many messages it took to get them watching. Run the business on panel figures alone and a strong month of new sign-ups can hide a leak in renewals that only becomes visible once growth slows.
Why a Growing Line Count Can Still Mean a Shrinking Business
Active lines are a stock, not a flow. The figure goes up when you create lines and down when they expire unrenewed, and the panel shows you only the net result. Two resellers can show the same active count while running very different businesses: one keeps most of the customers they sign, the other replaces a large share of their base every month through constant advertising and trials.
The second business looks fine on the dashboard until acquisition becomes harder, which it always does eventually. New customers also cost more to serve than settled ones. They ask setup questions, they need device help, they test the service at the busiest hour of the week, and a proportion of them never renew anyway. A reseller replacing customers rather than keeping them pays that onboarding cost again and again.
That is why the useful metrics sit around the edges of the line count: what goes in, what comes out, and what it costs to keep the rest.
IPTV Reseller KPIs That Actually Move the Business
None of these needs special software. Each can be worked out from a panel export and a simple spreadsheet, as long as you record a few things consistently from the day a line is created.
Renewal rate at expiry
Divide the number of lines renewed in a month by the number of lines that reached expiry in that month. Measuring against the whole active base instead produces a flattering figure, because most of your customers were never due to renew that month in the first place.
Split the result by plan length if you sell more than one. Monthly customers make a renewal decision twelve times a year; annual customers make it once. Blending them together hides what is happening in each group, and a shift in your plan mix can move the combined rate without anything changing in customer satisfaction.
First-month drop-off
This is the share of lines activated in a given month that are not renewed at their first expiry. It deserves its own line on your report because its causes differ from general churn. Long-standing customers who leave usually do so because of price, a run of service problems, or a better offer elsewhere. Customers who leave after one month usually never settled in: the setup was awkward, the app on their device behaved badly, or the service was not what they expected when they paid.
A rising first-month drop-off with a steady renewal rate among older customers is one of the clearest signals in the whole set. It points at onboarding and sales messaging rather than at the service itself.
Pro tip: Record the start month against every new line in your own sheet the moment you create it. Panel exports do not always preserve original activation dates once a line has been extended, and without them you cannot compare one month’s intake with another.

Trial conversion
Paid lines that started as trials, divided by trials issued. On its own it is a blunt figure, so look at it alongside two questions. When were the trials issued? A trial that runs through a quiet midweek period tells a customer much less than one that covers a busy weekend evening, when load is highest and problems are most likely to appear. And who received them? Trials handed to anyone who asks tend to convert poorly and generate a disproportionate amount of support work.
A trial that converts well but feeds a high first-month drop-off is worth investigating. It can mean the trial experience was better than the paid one, or that the customer was sold something the service does not deliver.
Support tickets per 100 active lines
Raw ticket numbers rise as you grow, so normalise them against your active base. Then tag every ticket with a simple category: setup and device, playback and buffering, login and account, billing and renewal. The total matters, but the mix matters more. A month where playback tickets double while everything else stays flat tells you something specific; a general rise in setup tickets after a busy acquisition push is expected and usually temporary.
Time from payment to a working stream
Creating a line in a panel takes moments. That is not the number that counts. What matters is how long it takes from the customer paying to the customer confirming they are watching, which includes sending credentials, getting the app installed and fixing whatever goes wrong on their particular device.
This is the metric most IPTV panel resellers never measure, and it feeds directly into first-month drop-off. A customer who spends their first evening struggling with an app forms an opinion that is hard to reverse. Clear, device-specific instructions help more than faster line creation ever will, and guides on setting up a Smart TV properly on the first install exist precisely because this is where many customer relationships are won or lost.
Net revenue per active subscriber
Take a month’s revenue, subtract what the service cost you, subtract refunds, then subtract a realistic estimate of the time spent on support. Divide by active subscribers. The support estimate will be rough, and that is fine; the point is to apply the same method every month so that the trend is honest.
This figure answers a question the others cannot: whether growth is making you better off. A reseller running heavy discounts to win customers can see line count climb while revenue per subscriber quietly falls. For a broader view of how that income becomes stable rather than volatile, see how UK reseller earnings become predictable.
Reading the Numbers Together Instead of One at a Time
Any single KPI can mislead you. The value comes from patterns across two or three of them, because each combination points at a different part of the operation.
| Pattern you notice | What it usually points to | Where to look first |
|---|---|---|
| Renewals falling while playback tickets rise | Service quality at peak times | Your provider’s stability during busy periods |
| High first-month drop-off, stable renewals among older customers | Onboarding friction | Setup instructions and time to a working stream |
| Strong trial conversion followed by early drop-off | Expectations set during sales | Trial conditions and how the service is described |
| Line count rising while revenue per subscriber falls | Discounting or growing support load | Promotions and the ticket mix |
| Tickets dominated by login and billing | Admin friction around renewals | Reminder timing and payment process |
If the first pattern appears and persists, the fix sits largely outside your own control, which is why it pays to understand the panel features that hold up under real load before you commit to a provider rather than after.
One caution applies across the whole table. With a small customer base, a handful of customers can swing any percentage sharply from one month to the next. Look at a rolling three-month view before drawing conclusions, and treat a single bad month as a prompt to look closer rather than a verdict.
What the Panel Records and What You Have to Log Yourself
Most panels cover the basics well. You can usually see creation date, expiry date, package, connection limit and line status, and some add simple reporting on package usage and upcoming expiries. If you are unsure what yours exposes, it helps to know what an IPTV reseller dashboard shows by default so you can see where the gaps are.
The rest has to come from you. At minimum, keep a record for each line of where the customer came from, whether they started on a trial, how many support contacts they needed in their first fortnight, any refund issued, and, when they leave, the reason if they are willing to give one. A single polite question at the point someone declines to renew is often the most useful piece of data you will collect all month.
Keep this record lean. Collect only what you will actually use, store it securely, and remember that customer details are personal data, so data protection rules such as UK GDPR apply to how you hold them.
It is also worth being clear-eyed about one dependency. These metrics describe the health of a business, and they only hold meaning if the service being resold is built on content its provider has the rights to distribute. IPTV is a delivery technology; whether a given service is lawful depends on rights and permissions, not on how well its IPTV reseller tracks renewals.

Numbers That Look Impressive and Tell You Very Little
Total lines ever created is the most common offender. It can only go up, so it can never warn you of anything. The same applies to the size of a provider’s content library or channel list: useful when choosing a provider, irrelevant as a measure of how your own business is doing.
Your credit or balance figure is an accounting number rather than a performance one. It tells you what you have available to spend, not whether customers are happy. Social followers and enquiry volume sit in a similar category; they measure interest, and interest that never becomes a renewing customer costs you time without paying for it.
Peak concurrent connections deserves a mention because it looks technical and important. It matters to your provider for capacity planning, and it can help you understand when your customers watch, but a high peak says nothing about whether those customers will still be with you next month.
Pro tip: If a figure can only ever rise, it is a milestone, not a KPI. Keep it for marketing if you like, but leave it off your monthly review.
Questions Resellers Ask About Tracking Performance
How often should these metrics be reviewed?
Monthly works for most resellers, because renewals and expiries follow a monthly rhythm. Add a quarterly look at the rolling trend so that one unusual month does not push you into changes you do not need.
What counts as a good renewal rate?
There is no reliable public benchmark for this market, and figures quoted without a source should be treated with suspicion. Plan mix, pricing and customer type all move the number. Your own trend over time is the useful comparison: a renewal rate that is steady or improving matters more than whether it matches someone else’s claim.
Do sub-resellers need to track anything different?
The same six metrics apply, with one addition. A sub-reseller depends on a parent reseller for escalations, so it is worth logging how many tickets you had to pass upward and how long they took to resolve. If that figure grows, your renewal rate will eventually follow it.
Can the panel produce these figures automatically?
Partly, depending on the panel. Most can export line data with dates and status, which covers renewals and expiries. Trial source, support contacts and reasons for leaving almost always need to be logged by you.
Where to Start This Month
The IPTV Reseller Panel KPIs that matter describe customer behaviour, not panel activity: whether people renew, whether new customers survive their first month, how much support they need, how quickly they start watching and what they are worth once your time is counted. None of them is perfect alone, and with a small base they will be noisy, so read them together and over several months. The practical first step is modest: start logging start month, trial status and ticket categories for every new line from today, because the next three months of data will tell you more about your business than any amount of historical line counts.
Monthly KPI Review Checklist
- Export this month’s expiring lines and count how many renewed
- Separate first-month customers from everyone else before calculating churn
- Compare trial conversion against when those trials were issued
- Re-tag any support tickets that went in without a category
- Check how long the slowest three new customers took to start watching
- Work out revenue per active subscriber using the same support estimate as last month
- Note the reasons given by customers who chose not to renew
- Compare every figure with the rolling three-month view, not just last month